Learn
Help docs
Get in touch
© Dovetail Research Pty. Ltd.
TermsPrivacy PolicySetting up a project

Projects are the containers that store all of your data in Dovetail. In them, you will do most of your work using notes, tags, highlights, and insights.
Table of contents
What is a project?
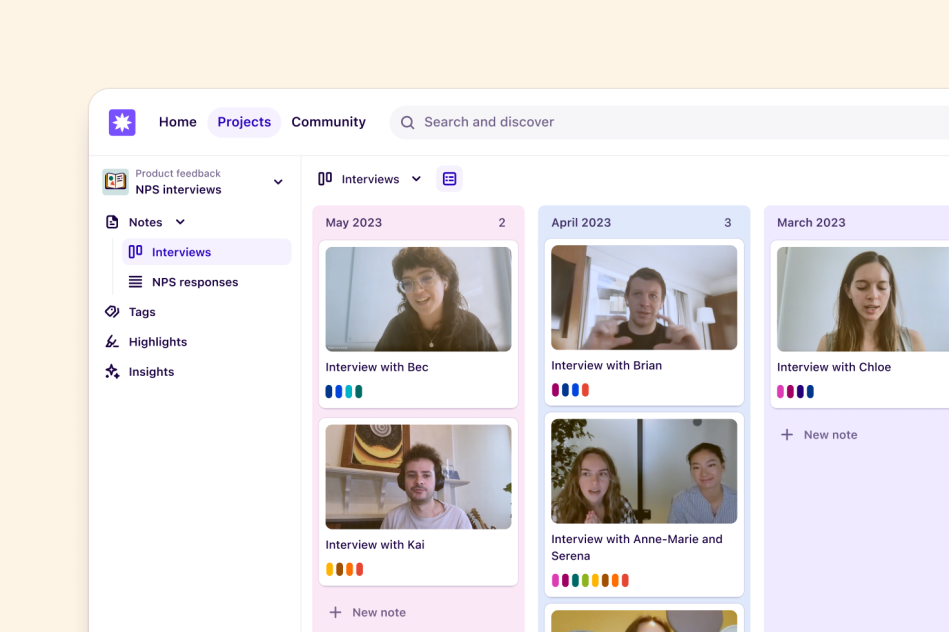
Projects are where you organize your data in Dovetail and transform research into insights. They are a database that contain your related notes, tags, highlights, and insights.
What to use a project for
Depending on the type of data you have and how you work, a single project could represent many things. For example, a project could contain:
Customer interviews – each note is a single interview.
Usability testing sessions – each note is a recording and transcript from a session.
User feedback – each note is a piece of feedback from a user.
Survey responses – each note is an individual response.
Multiple research methods – each group is a method.
Create a project
To create a new project, navigate to the Projects page. From the Create Project button, you can start a blank project or copy one of our community templates.
Configure your project
At the top of your sidebar, you’ll see the project title. Click on the down arrow to reveal a dropdown with several features and menu options. Here’s an overview of each.
Project name and icon: Rename your project by editing the text in this field. You can also swap the icon associated with your project.
Follow: Receive and manage notifications about new insights, or comments in the project.
Settings: Navigate and manage your project information, access, and trash, as well as options to export your data, convert the project to a template, and archive or delete the project.
Shown in the sidebar: Every project has a readme, notes, highlights, tags, insights, and charts. Clicking the 👁️ on the right of each of these items will hide or show it in the project sidebar. Re-order your sidebar by using the ⋮⋮ icon to drag items up or down.

Project objects
Projects contain 6 objects, all accessible via the sidebar:
Readme - This is the first thing new visitors will see when they open your project. It’s a great place to describe your project for others, set the background for your research, and provide additional context including goals, hypotheses or assumptions, research plan, timeline and project status.
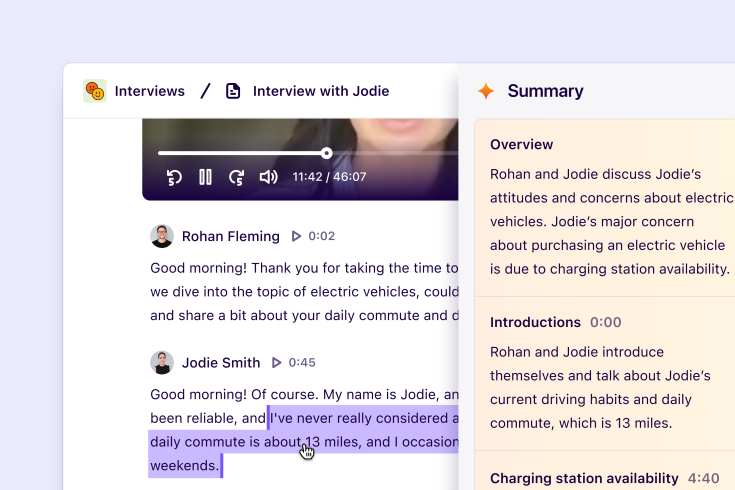
Notes - Notes live within projects and house your data - text, images, audio, video, etc.
Highlights - Highlights live on notes and are used to surface quotes and sections of text that are meaningful.
Tags - Tags are used to categorize highlights into common themes.
Insights - Insights live within projects and are where you summarize findings from your project and across other projects.
Charts - Charts live within projects and help you visualize patterns surfaced in your highlights and tags.
Give us feedback
Was this article useful?
Next article
Create notes and import data
Notes can contain text, images, audio, video, tables, transcripts, and more!
Log in or sign up
Get started for free
or
By clicking “Continue with Google / Email” you agree to our User Terms of Service and Privacy Policy
