Learn
Help docs
Get in touch
© Dovetail Research Pty. Ltd.
TermsPrivacy PolicyCreate notes and import data
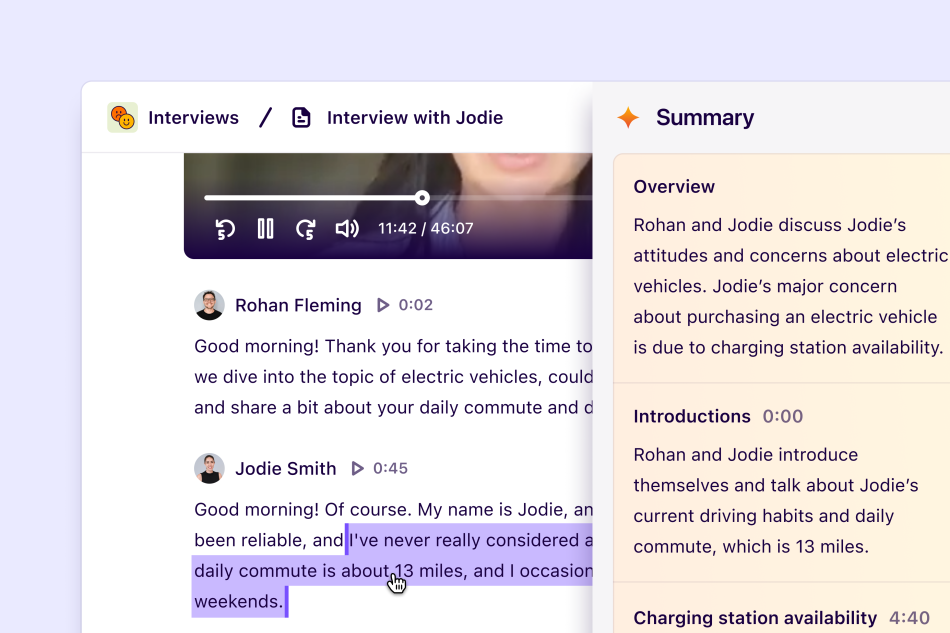
In Dovetail, research data is stored in ‘notes’. Notes can contain text, images, audio, video, tables, a transcript from an audio or video file, and more. Notes are flexible and can support a wide variety of research methodologies and data formats including:
Raw notes taken during a customer interview.
Video or audio from interviews, usability test, sales call, or product demo.
Survey responses or qualitative customer feedback imported via a spreadsheet.
Tweets imported via our Zapier integration.
By housing data in notes, you can capture key moments by highlighting and tagging this content. For example, for any video or audio content uploaded into a note can be transcribed by an advanced AI-powered speech engine. From there, you can create highlights to turn your raw recording into tagged, searchable audio and video clips.
Table of contents
Create a new note
Managers and contributors can create notes by opening a project and selecting Notes. From there, you can select one of the two options:
New note: This will open a blank note ready for you to add whatever you're working on.
Import: This will allow you to upload your files as separate notes in bulk. Selecting and importing data into notes from your device, Google Drive, Zoom, or OneDrive. If you select more than one video, audio, or PDF document, these will be split into and housed within individual notes in the project.
When you open a note, you'll see its body, the editor toolbar at the top, and a sidebar with icons to the right. In the sidebar, this is where you'll find and quickly navigate to your note's magic summary, highlights, tags, fields, and comments.
You can also collapse the sidebar from view. To do this, hover over the border and click the arrow to Hide sidebar. The sidebar can be re-opened at any time with the same action.
Rename your note
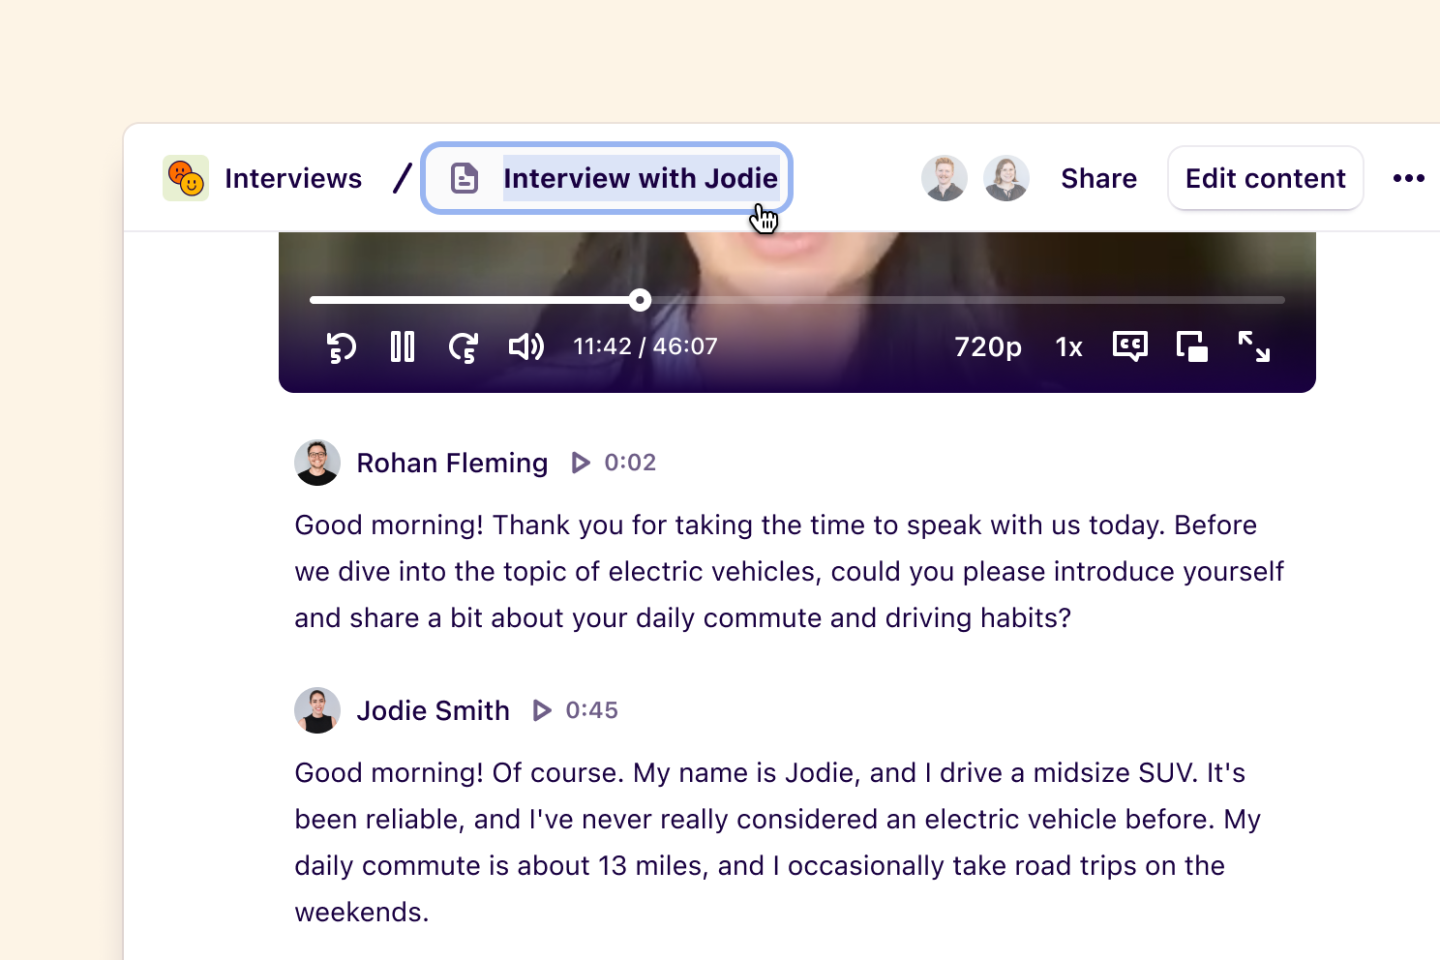
You can change the title of a note by clicking on it in the toolbar at the top of the note and entering a new name.
Import data with integrations
Bring in video, audio, and PDF files into notes using our first-party integrations - Zoom, OneDrive, and Google Drive. Find more information below on how to set these up for your account and start importing files:
Zoom - for Zoom cloud recordings
Google Drive - for Google Meet recordings, PDF, or Google cloud documents (sheet, slide or drawing)
OneDrive - for Microsoft Teams cloud recordings, PDF, Word documents, Excel sheets and Powerpoints.
Zapier - for connecting other apps like Slack, Intercom, and Google Forms to your Dovetail account
Transcribe video and audio files
Dovetail’s built-in transcription provides a powerful way to share stories about your research and allows you to develop a repository of searchable audio and video clips.
To generate a transcript for your audio or video file, you must first import your file into a note.
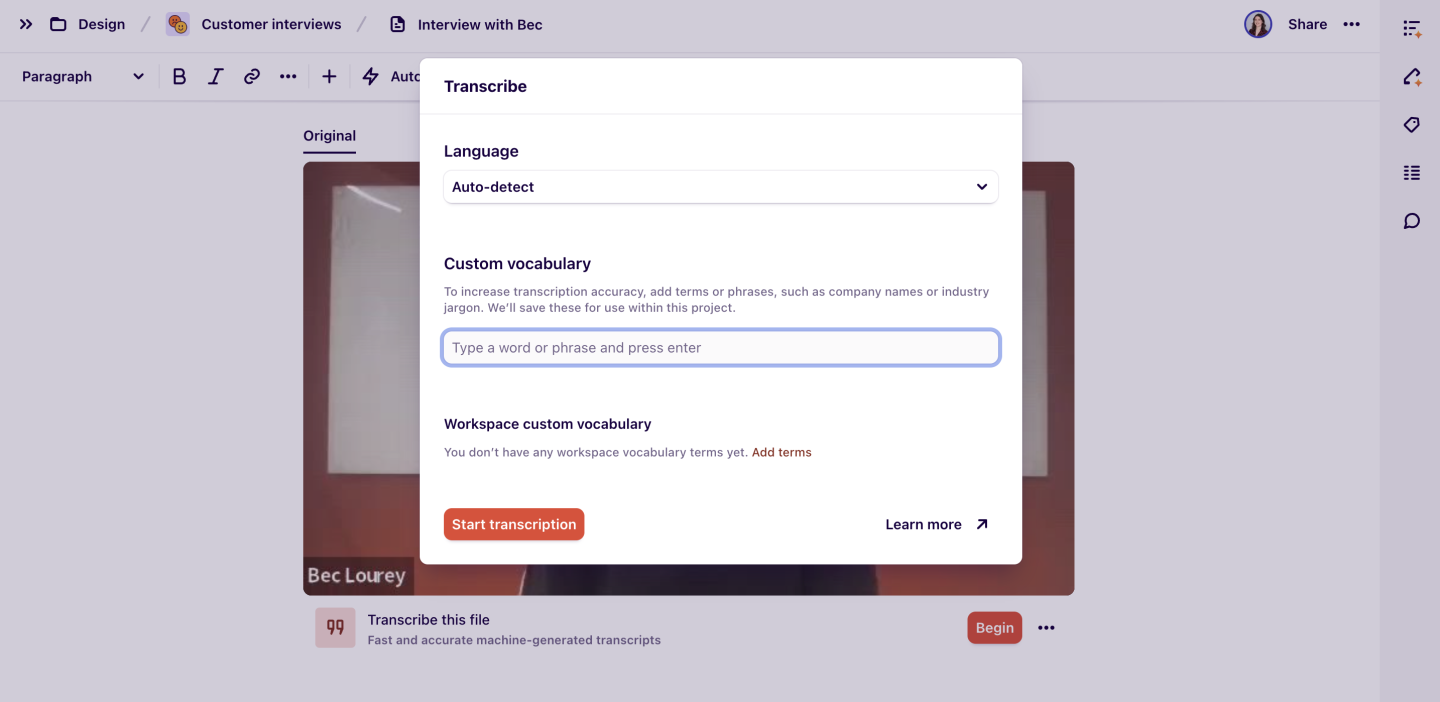
Once imported, select Begin under the video/audio player. Configure your desired settings under Language and Custom vocabulary, and press Start transcription.
What languages do we support for transcription?
You can transcribe conversations in 41 languages and receive a full native-language transcript back. Please find a full list of supported languages below.
Supported languages for transcription
Afrikaans, Arabic (Gulf), Arabic (Modern Standard), Bulgarian, Catalan, Chinese Simplified, Chinese Traditional, Croatian, Czech, Danish, Dutch, English (US), Farsi, Finnish, French, German, Greek, Hebrew, Hindi (Indian), Hungarian, Indonesian, Italian, Japanese, Korean, Latvian, Lithuanian, Malay, Norwegian, Polish, Portuguese (Brazilian), Romanian, Russian, Slovak, Slovenian, Spanish, Swedish, Tamil, Telugu, Thai, Turkish, and Vietnamese.
Automatically detect language
By selecting Auto-detect as your transcription language, Dovetail will automatically detect what language is being spoken and generate a transcription using that detected language.
Unfortunately, Dovetail cannot automatically detect every language that we currently support at this time. If the spoken language cannot be detected, a transcript will still be generated; however, it will not be accurate.
Please refer to the list of unsupported languages below before using auto-detect.
Unsupported languages for automatic detection
Bulgarian, Catalan, Czech, Greek, Finnish, Croatian, Hungarian, Lithuanian, Latvian, Norwegian, Polish, Romanian, Slovak, Slovenian, Swedish, and Vietnamese.
Automatically transcribe files
Video and audio files uploaded by selecting Import can be automatically transcribed by enabling the toggle before selecting your files.
Once enabled, selected files will be automatically transcribed using auto-detect.
Set up custom vocabulary for transcription
To improve the accuracy of transcripts, you can submit a list of custom words or phrases that are not found in a dictionary (for example, company names or industry jargon) before starting a transcription.
To do this, upload your file, select Begin, and navigate to Custom vocabulary.
From there, enter words or phrases into the textbox and select Start transcription when complete.
Share a custom vocabulary across the workspace
To avoid entering terms every time before a transcription, workspace admins can save a global list of up to 100 words or phrases at ⚙️ Settings > Transcription > Workspace custom vocabulary. This will apply to all transcripts users create across all projects in a workspace.
Import your own transcript
For when you need human-level accuracy with your transcripts or to analyze conversations in a language that we don't yet support – we've also added the option to bring your own transcript (in the form of a caption file).
We support importing any WebVTT (Web Video Text Tracks) caption file. When you upload a .vtt caption file, we'll use the caption timestamps to sync with your video or audio file playback.
To import your own transcript, click ••• (Actions) below a video or audio file > Click Upload transcript > Select a compatible .vtt file.
Please note
When importing .vtt files, the speaker names must be formatted as <v NAME > for Dovetail to extract the speaker name correctly.
If you have a non-compatible .srt caption file, you can convert this to a compatible .vtt file using Rev's free caption converter. This converter provides AI-level accuracy.
For human-level accuracy, we recommend using Rev.com's paid captioning services who can supply a compatible .vtt file for use in Dovetail once one of their skilled transcriptionists finish your job. Please ensure the Output File Format selected is WebVTT (.vtt) prior to payment on their service.
Import documents
Upload files from your device into notes within a project by selecting blank New note > Upload a file or Import data > Browse.
Once imported, a preview of your file will appear, allowing you to highlight, tag, comment and search text content for the following file types:
PDFs (.pdf)
Microsoft Word documents (.docx)
Microsoft Powerpoint files (.pptx)
Keynote presentations (.key)
Apple Pages (.pages)
Note: preview won't be available for other filetypes, e.g. zip files
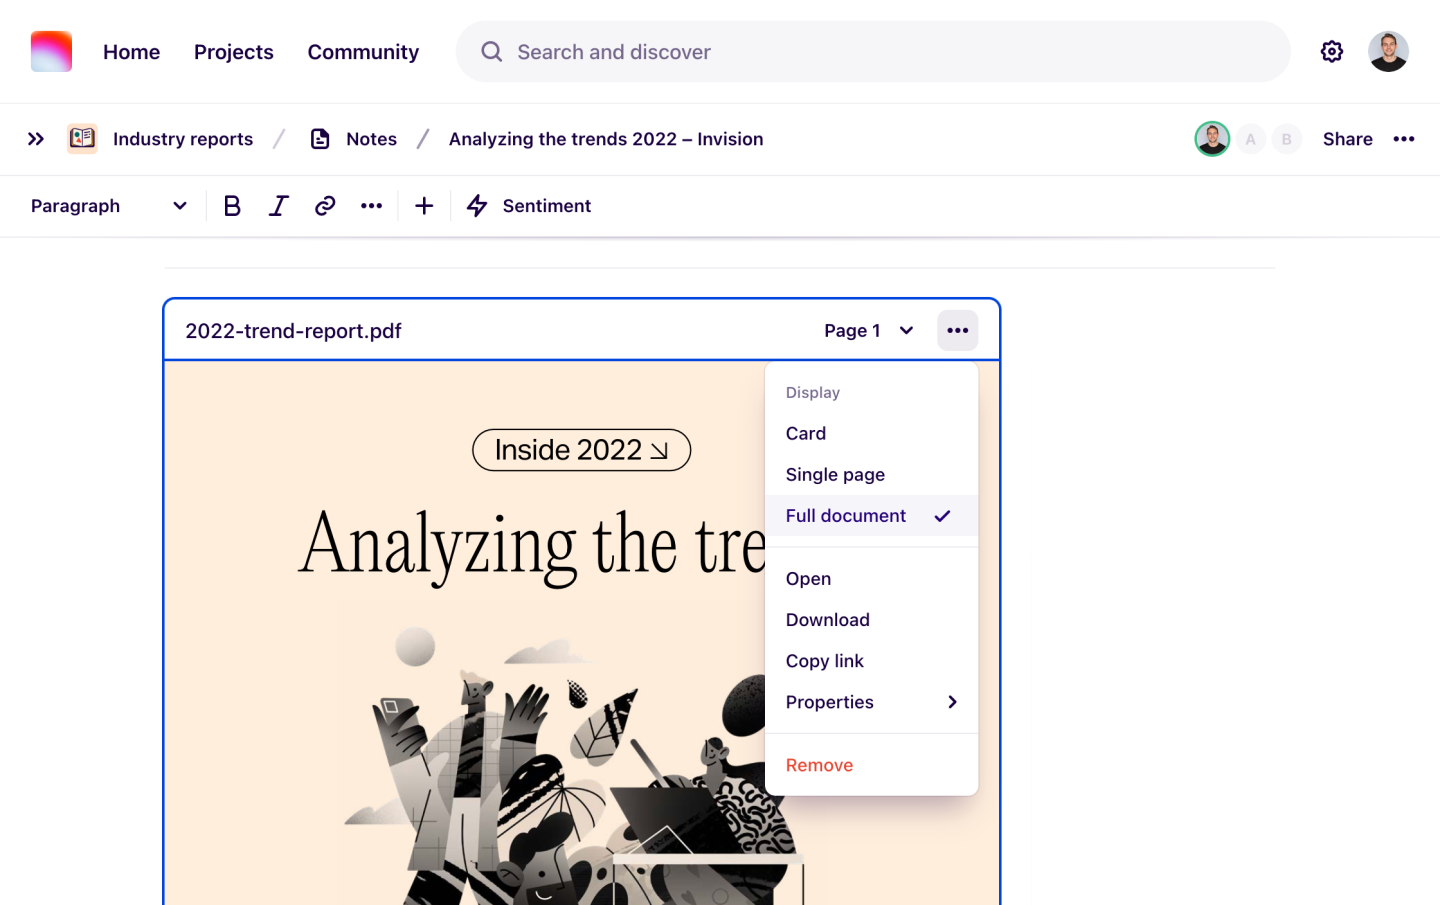
You can change the preview within your note to display: Full document, Single page or Card. To access these options, click on the "More" button in the preview window.
Import CSV spreadsheet data
You can create multiple notes at once from a single spreadsheet. This is handy for importing data like NPS feedback, survey responses, and customer feedback to bring in to Dovetail.
The file should be UTF-8 encoded Comma Separated Value (CSV) file with a header row and have at least 1 column each for:
Content – required, text format (300,000 character limit). This becomes the body of the note, which you can later highlight and tag.
Created date – must be in ISO 8601 date format or YYYY-MM-DD HH:MM
Title – text format (200 character limit)
During import, you will need to map columns from your spreadsheet to how it will be presented in your notes. For example, if you have a column for survey answers, you can add them to the body of your note by mapping this to the option ‘Content’.
If your spreadsheet contains a date column, Dovetail might have already detected it, which will be green.
Any fields that have been added to notes will also be available as fields to import into.
Automatic sentiment analysis for CSV import
You can leverage automatic sentiment analysis when importing a CSV document into notes to speed up your work.
To do this, toggle Run sentiment analysis on import and choose which sentiment analysis method you'd like to use.
General sentiment looks for any words that have strong positive or negative sentiment.
Targeted sentiment looks for strong positive or negative sentiment expressed in relation to something specific.
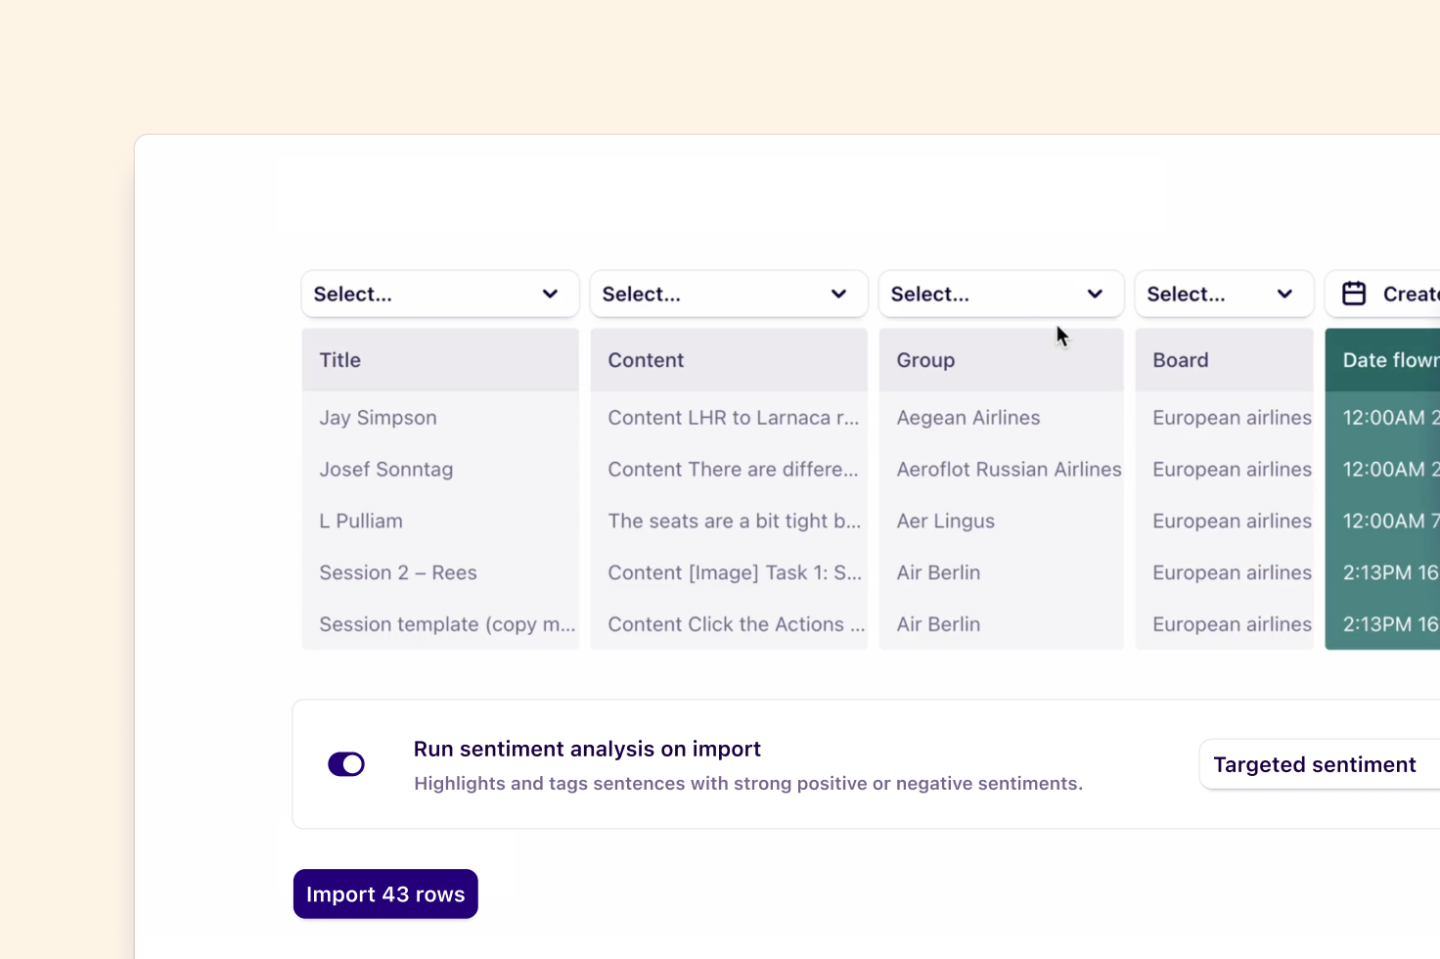
Sentiment analysis is conducted on the 'Content' column, and will be run on the whole note. Any sentences that are identified as having strong sentiments will be highlighted and tagged as either 'Positive' or 'Negative'.
Import a project from another workspace
Users with manager or contributor access have the ability to import projects that have been exported from another workspace at any time.
To learn how to import existing project work from another workspace, please visit Transfer projects across workspaces →
FAQs
How do I import spreadsheet data into a specific group in a note board?
Groups and field values are now the same, so if you have a particular group you'd like to import data into, ensure that you set the correct field value for the data you're importing.
For instance, let's say you've grouped your view by Feedback type with values NPS, In app feedback, and Community chat. If you want to import some NPS feedback to the NPS column, you need to ensure that your csv data has a column that says "NPS." When importing the CSV, you need to match the Feedback type field with that column.
The uncategorized column is where content will appear when it doesn't have a field value associated with the field used in the Group by setting in the top right of the view. If we removed this, it would be challenging for you to figure out where notes (that don't have a field value assigned) have 'disappeared.'
How long should file import and transcription take?
Your recording will be uploaded into a note and processed to ensure fast playback. The amount of time this takes depends on the length of the recording. In general, processing takes about 30% of the length of the file; e.g. a 60 minute recording will take approximately 20 minutes to process and transcribe.
You can close the note and continue using other parts of Dovetail while your file is uploading. You can safely leave Dovetail entirely (e.g. close the browser window or turn off your computer) while it’s processing and being transcribed, and come back later as well.
What video and audio formats do you support?
Dovetail supports the following video formats: mp4, mov, mpeg, avi, and audio formats: mp3, m4a, and wav.
I can’t seem to get my CSV import to work! Is there anything I can do to troubleshoot this?
Yes! Before importing your CSV, review the below requirements to ensure a smooth import process.
Formatting like headings, bold, italics, lists, tables, and images are not supported when importing from a CSV. They may cause a failure.
The maximum length for notes is 300,000 characters. No single cell in your CSV file should exceed this limit. This will cause a failure.
Dovetail will interpret two newline characters as separate paragraphs.
Your file needs to be encoded as UTF-8 (this is usually the default).
Your CSV file should end in a .csv file extension.
I'm experiencing processing errors for my video/audio file
It is possible to experience a processing error when uploading a video or audio file into Dovetail. This may be due to the file being an unsupported file type or there's a corruption in the file.
To troubleshoot this, you may be able to get the file to process successfully by re-exporting and saving a new copy the file using QuickTime or VLC player. This file must be into one of our supported file formats for video and audio files.
Dovetail supports video formats - mp4, mov, mpeg, avi - and audio formats - mp3, m4a, wav.
Do you have any file size limits for upload?
Yes, please view our technical limits for files for more info! Technical limits
I'm not able to highlight and tag my note. How can I fix this?
There may be a few reasons for this!
Your note may be locked from editing. The ability to edit a note can be toggled on/off in the Actions (•••) menu in the top right corner of the note page.
You may not have the right workspace role. Reach out to your workspace's admin to update your access to Manager or Contributor to edit project work in the workspace.
You may not have the right project access to edit the project. Check the project's Share settings to review your access and reach out to someone with Full access to update your access.
Can I download a note/transcript from my project?
Yes! Check out Download project data with information on how to do this.
Give us feedback
Was this article useful?
Next article
Edit notes and transcripts
Edit and update how notes are formatted in your project.
Log in or sign up
Get started for free
or
By clicking “Continue with Google / Email” you agree to our User Terms of Service and Privacy Policy
